 Mouood Mouood English Edition
According to Mouood, quoting by NatureFood:
Global food insecurity and famine from reduced crop, marine fishery and livestock production due to climate disruption from nuclear war soot injection
Abstract
Atmospheric soot loadings from nuclear weapon detonation would cause disruptions to the Earth’s climate, limiting terrestrial and aquatic food production. Here, we use climate, crop and fishery models to estimate the impacts arising from six scenarios of stratospheric soot injection, predicting the total food calories available in each nation post-war after stored food is consumed. In quantifying impacts away from target areas, we demonstrate that soot injections larger than 5 Tg would lead to mass food shortages, and livestock and aquatic food production would be unable to compensate for reduced crop output, in almost all countries. Adaptation measures such as food waste reduction would have limited impact on increasing available calories. We estimate more than 2 billion people could die from nuclear war between India and Pakistan, and more than 5 billion could die from a war between the United States and Russia—underlining the importance of global cooperation in preventing nuclear war.
Main
Extraordinary events such as large volcanic eruptions or nuclear war could cause sudden global climate disruptions and affect food security. Global volcanic cooling caused by sulfuric acid aerosols in the stratosphere has resulted in severe famines and political instability, for example, after the 1783 Laki eruption in Iceland1 or the 1815 Tambora eruption in Indonesia2,3. For a nuclear war, the global cooling would depend on the yields of the weapons, the number of weapons and the targets, among other atmospheric and geographic factors. In a nuclear war, bombs targeted on cities and industrial areas would start firestorms, injecting large amounts of soot into the upper atmosphere, which would spread globally and rapidly cool the planet4,5,6. Such soot loadings would cause decadal disruptions in Earth’s climate7,8,9, which would impact food production systems on land and in the oceans. In the 1980s, there were investigations of nuclear winter impacts on global agricultural production10 and food availability11 for 15 nations, but new information now allows us to update those estimates. Several studies have recently analysed changes of major grain crops12,13,14 and marine wild catch fisheries15 for different scenarios of regional nuclear war using climate, crop and fishery models. A war between India and Pakistan, which recently are accumulating more nuclear weapons with higher yield16, could produce a stratospheric loading of 5–47 Tg of soot. A war between the United States, its allies and Russia—who possess more than 90% of the global nuclear arsenal—could produce more than 150 Tg of soot and a nuclear winter4,5,6,7,8,9. While amounts of soot injection into the stratosphere from the use of fewer nuclear weapons would have smaller global impacts17, once a nuclear war starts, it may be very difficult to limit escalation18.
The scenarios we studied are listed in Table 1. Each scenario assumes a nuclear war lasting one week, resulting in the number and yield of nuclear weapons shown in the table and producing different amounts of soot in the stratosphere. There are many war scenarios that could result in similar amounts of smoke and thus similar climate shocks, including wars involving the other nuclear-armed nations (China, France, United Kingdom, North Korea and Israel).
|
Table 1 Number of weapons on urban targets, yields, direct fatalities from the bomb blasts and resulting number of people in danger of death due to famine for the different scenarios we studied |
Recent catastrophic forest fires in Canada in 201719 and Australia in 2019 and 202020,21 produced 0.3–1 Tg of smoke (0.006–0.02 Tg soot), which was subsequently heated by sunlight and lofted high in the stratosphere. The smoke was transported around the world and lasted for many months. This adds confidence to our simulations that predict the same process would occur after nuclear war.
Nuclear war would primarily contaminate soil and water close to where nuclear weapons were used22. Soot disperses globally once it reaches the upper atmosphere; thus, our results are globally relevant regardless of the warring nations. Here, we focus on the climate disruption from nuclear war, which would impact global food production systems on land and in the oceans. So far, an integrated estimate of the impacts of the entire range of war scenarios on both land- and ocean-based food production is missing. We examine the impacts of six war scenarios, generating 5 Tg to 150 Tg of soot, on the food supply (Table 1). We use model simulations of major crops and wild-caught marine fish together with estimated changes in other food and livestock production to assess the impacts on global calorie supply.
Results
Impacts on crops and fish catch productivity
Using climate, crop and fishery models (Methods), we calculate calorie production for different food groups, for each year after a range of six different stratospheric soot injections. The climatic impacts would last for about a decade but would peak in the first few years (Fig. 1).
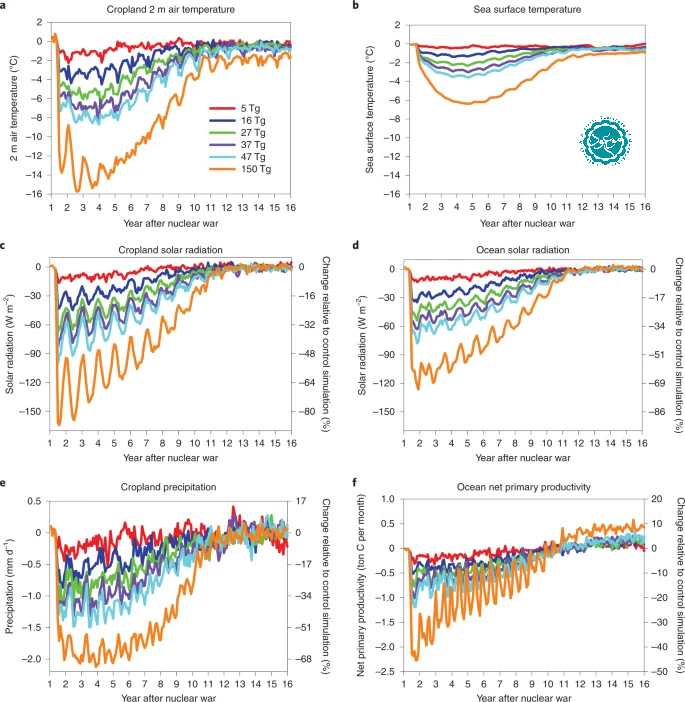
Fig. 1: Climatic impacts by year after different nuclear war soot injections.
a–f, Changes in surface temperature (a), solar radiation (c) and precipitation (e) averaged over global crop regions of 2000 (Supplementary Fig. 1) and sea surface temperature (b), solar radiation (d) and net primary productivity (f) over the oceans following the six stratospheric soot-loading scenarios studied here for 15 years following a nuclear war, derived from simulations in ref. 18. These variables are the direct climate forcing for the crop and fishery models. The left y axes are the anomalies of monthly climate variables from simulated nuclear war minus the climatology of the control simulation, which is the average of 45 years of simulation. The right y axes are the percentage change relative to the control simulation. The wars take place on 15 May of Year 1, and the year labels are on 1 January of each year. For comparison, during the last Ice Age 20,000 years ago, global average surface temperatures were about 5 °C cooler than present. Ocean temperatures decline less than for crops because of the ocean’s large heat capacity. Ocean solar radiation loss is less than for crops because most ocean is in the Southern Hemisphere, where slightly less smoke is present.
|
|
Fig. 2: Calorie production changes for crops and fish, and accumulated carbon change for grasses following different nuclear war soot injections.
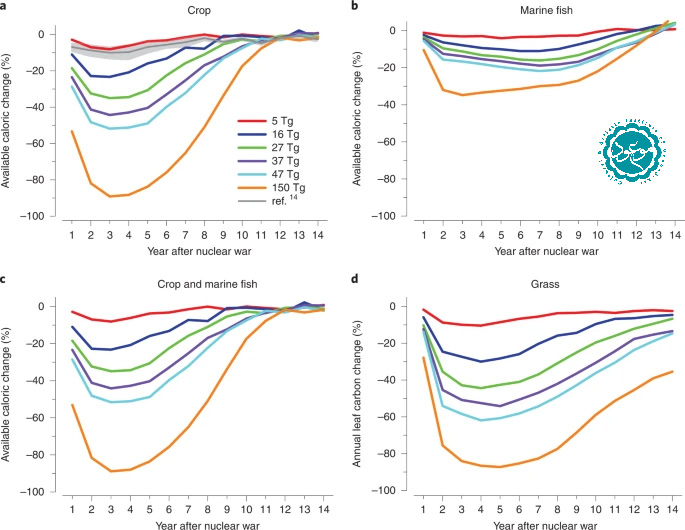 a–c, Global average annual crop calorie production changes (%; maize, wheat, rice and soybeans, weighted by their observed production (2010) and calorie content; a), marine fish production changes (%; b) and combined crop and fish calorie production changes (%; c) after nuclear war for the different soot-injection scenarios. d, Grass leaf carbon is a combination of C3 and C4 grasses, and the change is calculated as annual accumulated carbon. For context, the grey line (and shaded area) in a are the average (and standard deviation) of six crop models from the Global Gridded Crop Model Intercomparison (GGCMI, ref. 14) under the 5 Tg scenario. CLM5crop shows a conservative response to nuclear war compared with the multi-model GGCMI response.
|
|
Fig. 3: Global average human diet and protein composition and usage of crop-based products.
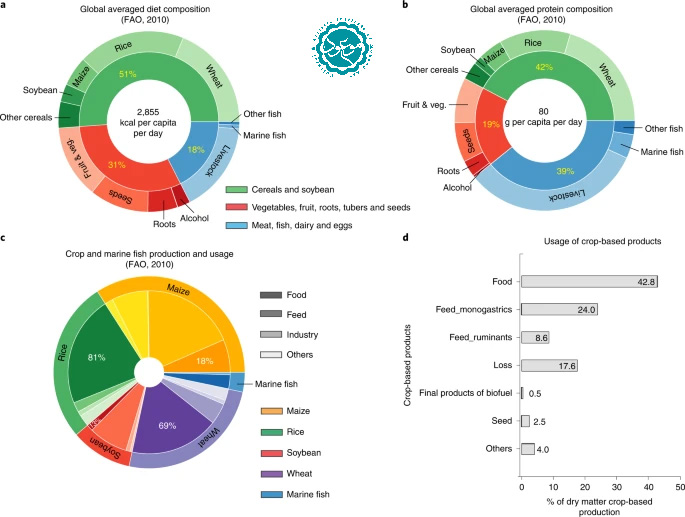 a, Global average human diet composition23. Percentages are % of available calories. Veg. is vegetables. b, Global average human protein diet composition23. Marine wild capture contributes 75% of marine fish46. Percentages are % of dry matter production. c, Distribution of four major cereal crops and marine fish between human food and other uses24,47. Percentages are % of dry matter production. d, Usage of crop-based products in 2010 (% of dry matter crop-based production)26. The colour gradient legend in grey in c illustrates the usage of different crops and fish in colours. While humans consume most of the wheat and rice grown, most maize and soybeans are used for livestock feed.
|
Cooling from nuclear wars causes temperature limitations for crops, leading to delayed physiological maturity and additional cold stress14. Calorie reduction from agriculture and marine fisheries shows regional differences (Supplementary Fig. 4), with the strongest percentage reductions over high latitudes in the Northern Hemisphere. Even for the India–Pakistan case, many regions become unsuitable for agriculture for multiple years. For example, in the 27 Tg case, mid- to high latitudes of the Northern Hemisphere show reductions in crop calorie production greater than 50%, along with fish catch reductions of 20–30%. The nuclear-armed nations in mid- to high latitude regions (China, Russia, United States, France, North Korea and United Kingdom) show calorie reductions from 30% to 86%, and in lower latitudes (India, Pakistan and Israel), the reduction is less than 10% (Supplementary Tables 1 and 2). Impacts in warring nations are likely to be dominated by local problems, such as infrastructure destruction, radioactive contamination and supply chain disruptions, so the results here apply only to indirect effects from soot injection in remote locations.
Impacts on total human calorie intake
To estimate the effect on the total food calories available for human consumption, we consider diet composition, calorie content of different food types, crop usage and changes in food production that we did not directly model (Methods). In 2010, FAO23 reported that 51% of global calorie availability came from cereals, 31% from vegetables, fruit, roots, tubers and nuts and 18% from animal and related products, of which fish contributed 7%, with marine wild catch contributing 3% (Fig. 3a). The crops and fish we simulated provide almost half of these calories and 40% of the protein. Further, only portions of the simulated food production are available for human consumption. Many crops (for example, maize and soybean) are used mainly for non-food uses such as livestock feed (Fig. 3c).
In addition, the total number of calories available as food is highly dependent on human reactions to nuclear wars. We assume that international trade in food is suspended as food-exporting nations halt exports in response to declining food production (Methods). Furthermore, we considered three societal responses, Livestock, Partial Livestock and No Livestock (Supplementary Table 3). For the Livestock response scenario, representing a minimal adaptation to the climate-driven reduction in food production, people continue to maintain livestock and fish as normal. Although harvesting a larger share of crop residues for feed or adding new feed such as insect-based supplements may increase the potential livestock feed, we assume that no new feed supplements are added and the ratio of agricultural grains, residues and grazed biomass to livestock feed is the same. Calories from all crops are reduced by the average reduction in our four simulated crops, and calorie changes from marine wild-caught fish are calculated with business-as-usual fishing behaviour. The No Livestock response represents a scenario where livestock (including dairy and eggs) and aquaculture production are not maintained after the first year, and the national fractions of crop production previously used as feed are now available to feed humans. In addition, fishing pressure intensifies, simulated through a fivefold increase in fish price15. Similar responses took place in New England in the ‘year without a summer’ after the 1815 Tambora volcanic eruption2. Even though the temperature changes were smaller than modelled in any of the nuclear war scenarios here, crop failures forced farmers to sell their livestock because they could not feed them3, and previously unpalatable fish were added to their diet2,3,25. We test a full range (0–100%) of the fraction of food-competing feed26 that could be used by humans and select 50% as an example in some plots and tables. Between the Livestock and No Livestock cases, we also consider a Partial Livestock case, in which the remaining portion of livestock grain feed after converting to human consumption would be used for raising livestock.
Final biofuel products (biodiesel and ethanol) only count for 0.5% of the plant-based products27, which could be repurposed as food in the form of plant oil (~1.8% of total food calories) and alcohol (3.4% of total food calories). Byproducts of biofuel have been added to livestock feed and waste27. Therefore, we add only the calories from the final product of biofuel in our calculations. Global averaged household waste is around 20% (ref. 28). If we assume that after a nuclear war there would be 50% less or 100% less household waste, these extra calories would become available.
National consequences of calorie loss depend on the amount of fallow cropland, regional climate impacts, population levels and assuming a complete halt of international food trade (Methods; Fig. 4). Here, we focus on two calorie intake levels in nations: calorie intake to maintain normal physical activity and calorie intake lower than the basal metabolic rate (also known as the resting energy expenditure)29. The two levels vary in countries depending on the composition and physical activity of the population. Food consumption of less than the first level would not allow a person to maintain their normal physical activity and keep their weight at the same time, and less than the basal metabolic rate would cause fast weight loss even with only sedentary activity and thus would quickly lead to death29. With a 5 Tg injection, most nations show decreasing calorie intake relative to the 2010 level but still sufficient to maintain weight (Fig. 4 and Supplementary Fig. 5). With larger soot-injection cases, severe starvation occurs in most of the mid–high latitude nations under the Livestock Case. When 50% of food-competing feed is converted for human consumption in each nation, some nations (such as the United States) would maintain sufficient calorie intake under scenarios with smaller soot injections, but weight loss or even severe starvation would occur under larger soot-injection cases (Fig. 4 and Supplementary Fig. 5).
| Fig. 4: Food intake (kcal per capita per day) in Year 2 after different nuclear war soot injections.
The left map is the calorie intake status in 2010 with no international trade; the left column is the Livestock case; the middle column is the Partial Livestock case, with 50% of livestock feed used for human food and the other 50% still used to feed livestock; and the right column is the No Livestock case, with 50% of livestock feed used for human food. All maps assume no international trade and that the total calories are evenly distributed within each nation. Regions in green mean food consumption can support the current physical activity in that country; regions in yellow are calorie intake that would cause people to lose weight, and only sedentary physical activity would be supported; and regions in red indicate that daily calorie intake would be less than needed to maintain a basal metabolic rate (also called resting energy expenditure) and thus would lead to death after an individual exhausted their body energy reserves in stored fat and expendable muscle28. 150 Tg + 50% waste is half of the household waste added to food consumption, and 150 Tg + 100% waste is all household waste added to food consumption. |
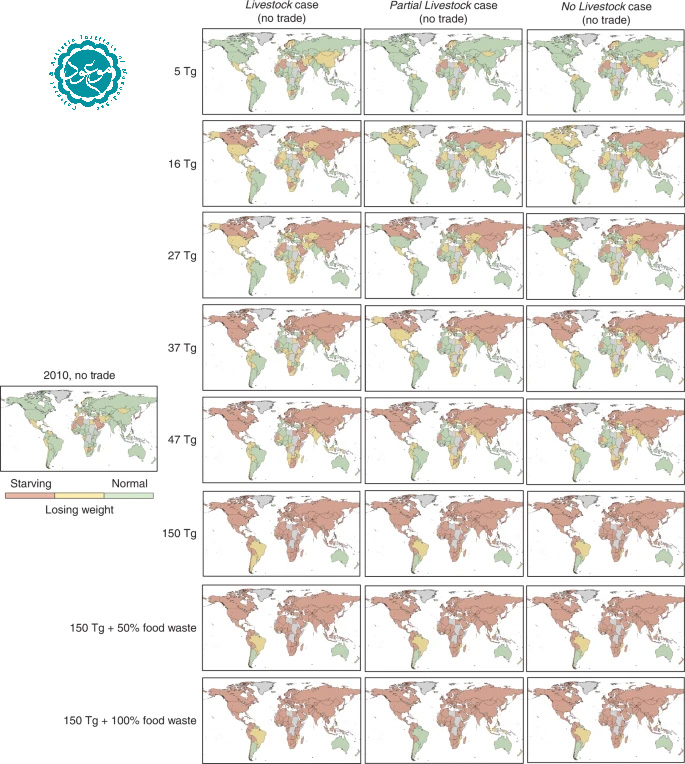
Under the 150 Tg scenario, most nations would have calorie intake lower than resting energy expenditure29. One exception is Australia. After we turn off international trade, wheat contributes almost 50% of the calorie intake in Australia, and production of rice, maize and soybean in Australia are less than 1% that of wheat23,24. Therefore, the wheat response to simulated nuclear wars largely determines calorie intake in Australia. Because spring wheat is used to represent wheat, and simulated spring wheat there shows increasing or small reductions under nuclear war scenarios in which more favourable temperatures occur for food production, the calorie intake in Australia is more than other nations. However, this analysis is limited by the FAO data, which are collected at national levels. Within each nation, particularly large ones, there may be large regional inequities driven by infrastructure limitations, economic structures and government policies. New Zealand would also experience smaller impacts than other countries. But if this scenario should actually take place, Australia and New Zealand would probably see an influx of refugees from Asia and other countries experiencing food insecurity.
The global average calorie supply post-war (Fig. 5a) implies that extreme regional reductions (Fig. 4) could be overcome to some extent through trade—but equal distribution of food globally would probably be a major challenge. Under the Livestock case, if food were evenly distributed over the world and household waste were 20% as in 201028, there would be enough food for everyone under the 5 Tg scenario to support their normal physical activity; if household waste were reduced from 20% to 10%, extra calories would support everyone under the 16 Tg scenario; and if there were no household waste, even under the 27 Tg case, everyone would consume sufficient calories for survival. With the most optimistic case—100% livestock crop feed to humans, no household waste and equitable global food distribution—there would be enough food production for everyone under the 47 Tg case. Assuming international trade ceased and food was distributed optimally within each country11, such that the maximum number of people were given the calorie intake to maintain their weight and normal physical activity28, the percentage of population that could be supported can be calculated (Fig. 5b and Supplementary Fig. 6b). Under the 150 Tg case, most countries would have less than 25% of the population survive by the end of Year 2 (Supplementary Fig. 7). In 2020, 720 million–811 million people suffered from undernutrition worldwide30, despite food production being more than sufficient to nourish a larger world population. Thus, it is likely that food distribution would be inequitable both between and within countries.
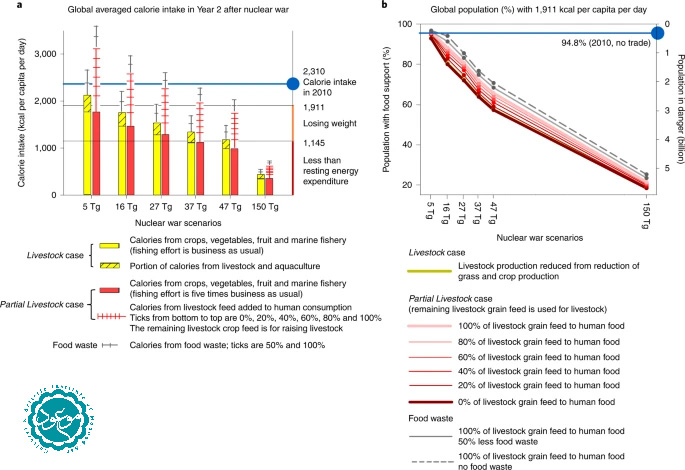
| Fig. 5: Overview of global calorie intake and sensitivity to livestock and food waste assumptions.
a, Global average change in calorie intake per person per day in Year 2 post-war under the Livestock case (yellow bars) and for the Partial Livestock case (red bars), assuming that all food and waste is evenly distributed. For the Partial Livestock case, additional calories potentially available by human consumption of animal feed, mainly maize and soybeans, are plotted for various portions of converted animal feed (pink tick marks), and the remaining livestock crop feed is used for raising livestock. Critical food intake levels are marked in the right margin. b, Without international trade, the global population (%) that could be supported, although underweight, by domestic food production at the end of Year 2 after a nuclear war if they receive the calories supporting their regular physical activity29 and the rest of the population would receive no food, under the Livestock and Partial Livestock cases. The blue line in b shows the percentage of population that can be supported by current food production when food production does not change but international trade is stopped. National data are calculated first (Supplementary Tables 4 and 5 and Supplementary Fig. 5) and then aggregated to global data. |
Discussion
Using state-of-the-art climate, crop and fishery models, we calculate how the availability of food supplies could change globally under various nuclear war scenarios. We combine crops and marine fish and also consider whether livestock and animal products continue to be an important food source.
For a regional nuclear war, large parts of the world may suffer famine—even given the compensating behaviours considered in this paper. Using crops fed to livestock as human food could offset food losses locally but would make limited impacts on the total amount of food available globally, especially with large atmospheric soot injections when the growth of feed crops and pastures would be severely impaired by the resulting climate perturbation. Reducing household food waste could help in the small nuclear war cases but not in the larger nuclear wars due to the large climate-driven reduction in overall production. We find particularly severe crop declines in major exporting countries such as Russia and the United States, which could easily trigger export restrictions and cause severe disruptions in import-dependent countries24. Our no-trade response illustrates this risk—showing that African and Middle Eastern countries would be severely affected.
Our analysis of the potential impacts of nuclear war on the food system does not address some aspects of the problem, leaving them for future research. In all the responses, we do not consider reduced human populations due to direct or indirect mortality and possible reduced birth rate. The total number and composition of population changes would affect available labour, calorie production and distribution. Also, we do not consider farm-management adaptations such as changes in cultivar selection, switching to more cold-tolerating crops or greenhouses31 and alternative food sources such as mushrooms, seaweed, methane single cell protein, insects32, hydrogen single cell protein33 and cellulosic sugar34. Although farmer adaptation35 and alternative food sources could reduce the negative impact from a simulated nuclear war, it would be challenging to make all the shifts in time to affect food availability in Year 2, and further work should be done on these interventions. Current food storage can alleviate the shortage in Year 1 (ref. 14) but would have less impact on Year 2 unless it were rationed by governments or by the market. Expanding or shifting cropping land to favourable climate regions would increase crop production. Further studies on adaptation and the impacts on short-term food availability are needed, but those topics are beyond the scope of this study. Adaptation in fisheries is also not considered, such as changes in the use of discarded bycatch and offal in fisheries. These include reduced availability of fuel, fertilizer and infrastructure for food production after a war, the effects of elevated ultraviolet radiation36 on food production and radioactive contamination37. While this analysis focuses on calories, humans would also need proteins and micronutrients to survive the ensuing years of food deficiency (we estimate the impact on protein supply in Supplementary Fig. 3). Large-scale use of alternative foods, requiring little-to-no light to grow in a cold environment38, has not been considered but could be a lifesaving source of emergency food if such production systems were operational.
In conclusion, the reduced light, global cooling and likely trade restrictions after nuclear wars would be a global catastrophe for food security. The negative impact of climate perturbations on the total crop production can generally not be offset by livestock and aquatic food (Fig. 5a). More than 2 billion people could die from a nuclear war between India and Pakistan, and more than 5 billion could die from a war between the United States and Russia (Table 1). The results here provide further support to the 1985 statement by US President Ronald Reagan and Soviet General Secretary Mikhail Gorbachev and restated by US President Joe Biden and Russian President Vladimir Putin in 2021 that ‘a nuclear war cannot be won and must never be fought’.
Methods
We use a state-of-the-art global climate model to calculate the climatic and biogeochemical changes caused by a range of stratospheric soot injections, each associated with a nuclear war scenario18 (Tables 1 and 2). Simulated changes in surface air temperature, precipitation and downward direct and diffuse solar radiation are used to force a state-of-the-art crop model to estimate how the productivity of the major crops (maize, rice, spring wheat and soybean) would be affected globally, and changes in oceanic net primary production and sea surface temperature are used to force a global marine fisheries model. We combine these results with assumptions about how other crop production, livestock production, fish production and food trade could change and calculate the amount of food that would be available for each country in the world after a nuclear war.
| Table 2 Changes in food calorie availability (%) in Year 2 after a nuclear war for the nations with nuclear weapons and global average assuming no trade after simulated nuclear wars under the Livestock case, the Partial Livestock case and the No Livestock case with 50% livestock feed to human consumption |
The simulated surface climate disruptions due to the nuclear war scenarios are summarized in Fig. 1. Averaged over the current crop regions, surface downwelling solar radiation reduces by 10 W m−2 (5 Tg soot injection) to 130 W m−2 (150 Tg soot injection). With less energy received, the maximum average 2 m air temperature reductions range from 1.5 °C (5 Tg soot injection) to 14.8 °C (150 Tg soot injection), peaking within 1–2 years after the war, with temperature reduction lasting for more than 10 years. The cooling also reduces precipitation over summer monsoon regions. Similar but smaller reductions of solar radiation and temperature are projected in marine regions (Fig. 1b,d), with resulting changes in lower trophic-level marine primary productivity. We applied local changes at every grid cell to the crop and fish models.
Climate model
All nuclear war scenarios9,18are simulated using the Community Earth System Model (CESM)39. This model includes interactive atmosphere, land, ocean and sea ice. Both atmosphere and land have a horizontal resolution of 1.9° × 2.5°, and the ocean has a horizontal resolution of 1°. The atmospheric model is the Whole Atmosphere Community Climate Model version 4 (ref.40). The land model is the Community Land Model version 4 with the carbon–nitrogen cycle. CESM output at 1- and 3-hour resolution, including 2 m air temperature, precipitation, specific humidity and downward longwave radiation and solar radiation (separated into direct and diffuse radiation), is used to drive the offline crop model simulations. There are three ensemble members of the control simulation, which repeats the climate forcing of 2000 for 15 years, three ensemble members of the 5 Tg case and one simulation for each other nuclear war scenario.
In all the simulations, the soot is arbitrarily injected during the week starting on May 15 of Year 1. Our scenarios assume that all stored food is consumed in Year 1 and we present analysis of the remaining food in Year 2. If the war occurred at the end of a calendar year, there would still be food available in Year 2, so what we label Year 2 should be relabelled Year 3. However, since the severe climate and food impacts last for more than 5 years (Figs.1and2), the same conclusions apply to a world after a nuclear war.
Direct climate model output use
Because climate models have biases, it is typical to bias correct model output before using it as input for crop models. There are various techniques that attempt to use past observational data to address changes in the mean and variance, but none are perfect and all are limited by assumptions that future relations between model output and crop model input can be based on the recent past. A common method14is the delta method in which an observational reanalysis weather dataset is used and monthly means of temperature, precipitation and insolation are modified according to the climate model simulations. This comes with the advantage of realistic internal variability important for crop modelling12,13,14but does not adjust changes in variance, which might be an unrealistic assumption under higher emission scenarios, such as the 150 Tg case. Here, because we are using a crop model that has already been calibrated with the same climate model that we are using, we use raw climate model output (1.9° × 2.5°) to force the crop model, and this allows variance to change too.
Crop model
Crop simulation uses the Community Land Model version 5 crop (CLM5crop)41,42,43in the Community Earth System Model version 2 (CESM2). Dynamic vegetation is not turned on. CLM5crop has six active crops, maize, rice, soybeans, spring wheat, sugar cane and cotton, and also simulates natural vegetation, such as grasses. In this study, we used the output of the cereals (maize, rice, soybeans and spring wheat) and grasses. Although CLM5crop does not simulate winter wheat, we assume winter wheat production is changed by the same amount as spring wheat, which has been found in other studies14; however, this may underestimate the winter wheat response, because winter wheat would experience colder temperatures during its growing period that would be more likely to cross critical thresholds14. Surface ozone and downward ultraviolet radiation would also be impacted by nuclear war36, but CLM5crop is not able to consider those impacts, which might exacerbate the losses. In addition, the crop model does not consider the availability of pollinators, killing frost and alternative seeds. The model simulates rainfed crops and irrigated crops separately, and all results presented here refer to the total production of rainfed and irrigated crops. Irrigated crops are simulated under the assumption that freshwater availability is not limiting43. Although evaporation is reduced with cooling, it is possible that our result may underestimate the negative impact from precipitation reduction, especially for the large injection cases.
CLM5crop was evaluated41using FAO observations (average of 1991–2010), and it does a reasonable job of reproducing observed spatial pattern of maize, rice, soybean and spring wheat yield. Also, time series of crop yields simulated by CLM5crop compare with FAO data from 2006 to 2018, and CLM5crop reasonably represents global total production and average yields of maize, rice, soybean and spring wheat42.
CLM5crop is spun up for 1,060 years by repeating the past 10 years of the CESM control to reach the equilibrium of four soil carbon pools. The crop simulations are at the same resolution as CESM simulations (1.9° × 2.5°). The crop planting date is determined by growing degree days, and the location of cropland is fixed for all crops.
Fishery model
Fish and fisheries responses are simulated with the BiOeconomic mArine Trophic Size-spectrum (BOATS) model15,44,45. BOATS was used to calculate the size-structured biomass of commercially targeted fish based on gridded (1° horizontal resolution) inputs of sea surface temperature and oceanic net primary production from CESM. The model also interactively simulates fishing effort and fish catch through a bioeconomic component that depends on fish price, cost of fishing, catchability and fisheries regulation15. Details are found in ref.15and references therein.
Combining crop and marine fish data
Supplementary Table1shows the total calorie reductions for each of the nine nuclear states from just the simulated crops and marine fish. Data for countries can be found in Supplementary Table2.
To calculate nation-level calories available from simulated crops and fish, we weight the production by the calorie content of each type of food. We use data from FAO23,24,46,47. Nation-level calorie reduction (%) from total production of maize, rice, soybean, wheat and marine fish is thus calculated as:
wiy=PiciRiy∑5i=1PiciRiywiy=PiciRiy∑i=15PiciRiy
(1)
and
Ry=∑i=15Riywiy,Ry=∑i=15Riywiy,
(2)
where index i is maize, rice, soybean, wheat or marine fish wild catch, wiy is the calorie weight of each commodity per country each year, Pi is the national production of item i in FAO-Food Balance Sheet (FBS)23,24, ci is calories per 100 g dry mass for each item23, Riy is national production reduction (%) of each item in year y after the nuclear wars and Ry is nation-averaged calorie reduction (%) of the five items in year y after the nuclear wars.
Effects on other food types
Other crops
National averaged calorie reduction (%) of the four simulated crops is applied to the total calories of all crops in 2010 to estimate simulated nuclear war impacts on this category.
Livestock and aquaculture
We assume these two types of food share a similar response to simulated nuclear war as they involve feeding animals in a relatively controlled environment. For global calculations for livestock, we assume that 46% are fed by pasture and 54% are fed by crops and processed products48and use national-level data26to calculate reduction of livestock feed from pasture and crop-based products. We assume that livestock production is linearly correlated with the feed. Annual leaf carbon of grasses (both C3 and C4) is used to estimate pasture changes, and reduction of the four simulated crops is used for crop feed changes. For aquaculture, the feed is only from crops and processed products, and the production is also correlated with the amount of feed fish receive. Direct climate change impacts on livestock and fish are not considered.
Inland fish capture is not considered in this study. Because inland fish contribute only 7% of total fish production46, adding inland fisheries would not change the main conclusions of this study.
International trade
All food commodity trade calculations are based on the 2010 FAO Commodity Balance Sheet (FAO-CBS), FAO-FBS and processed data from previous studies24,27,28,47. This dataset provides the production and usage of each food and non-food agricultural product for each country and imports and exports and thus allows the calculation on a national basis of food usage and calorie availability.
Domestic availability of a food in each country comes from domestic production and reserves, reduced by exports and increased by imports. We calculate no international trade by applying the ratio of domestic production and domestic supply to each food category and the food production in different usages:
Cfood−notrade=Cfood×PdpPdsCfood−notrade=Cfood×PdpPds
(3)
whereCfoodis national-level calorie supply from different food types26,46,Cfood-notradeis national-level calorie supply from different food types with the assumption of no international trade,Pdpis national-level domestic production for each type of food in FAO-CBS andPdsis national-level domestic supply for each type of food in FAO-CBS. Domestic supply is the available food on the market, including domestic production, export and import.
Food usage of maize, soybean, rice and wheat is calculated from FAO-CBS. In FAO-CBS, maize products are maize and byproduct maize germ oil, soybean products are soybean and byproducts soybean oil and soybean cake, rice products are rice and byproduct rice bran oil and wheat product is wheat. Products for food purposes are the sum of food supply in each category and the processing product minus the total byproducts (the difference includes processing for the purpose of alcohol or sugar).
Calorie calculations
For theLivestockcase, national-level available calories are calculated by
CL=Cplantbased×(1−Rcy)+Clivestock−ruminant×(1−Rgrass)+Clivestock−monogastric×(1−Rcy)+Clivestock−monogastric×Rgrass×(1−Rcy)×Fruminant−cropfeedFmonogastric−cropfeed+Caquaculture×(1−Rcy)+Cmarine−catch×(1−Rmarine−catch−y)+(1−Rcy)×Cplantbased×ffinal−product−biofuelffoodCL=Cplantbased×(1−Rcy)+Clivestock−ruminant×(1−Rgrass)+Clivestock−monogastric×(1−Rcy)+Clivestock−monogastric×Rgrass×(1−Rcy)×Fruminant−cropfeedFmonogastric−cropfeed+Caquaculture×(1−Rcy)+Cmarine−catch×(1−Rmarine−catch−y)+(1−Rcy)×Cplantbased×ffinal−product−biofuelffood
(4)
whereCLis calories available in each nationL(kcal per capita per day) under theLivestockcase,Cplantbased,Clivestock-ruminantandClivestock-monogastricare calories available from plant-based products, ruminants and monogastrics27andCaquacultureandCmarine-catchare calculated by calorie availability from fish27multiplied by the ratio of aquaculture and catch46.Rgrassis grass production change, andRmarine-catch-yis marine capture change.Fruminant-cropfeedis the fraction of crop feed for ruminant, andFmonogastric-cropfeedis the fraction of crop feed for monogastrics26.Rcyis crop production change calculated as:
wiy=PiciRiy∑4i=1PiciRiy,wiy=PiciRiy∑i=14PiciRiy,
(5)
and
Rcy=∑i=14RiywiyRcy=∑i=14Riywiy
(6)
where indexiis maize, rice, soybean or wheat,wiyis the calorie weight of each commodity per country each year,Piis the national production of itemiin FAO-CBS47,ciis calories per 100 g retail weight for each item23andRiyis national production change (%) of each item in yearyafter the nuclear wars.ffinal−product−biofuelffinal−product−biofuelis the fraction of final product of biofuel in plant-based product, andffoodis the fraction of food in plant-based product.
For theNo Livestockcase, national-level available calories are calculated by
CNL=Cplantbased×(1−Rcy)+Cmarine−catch×(1−Rmarine−catch−y)+Cplantbased×ffeed−to−food×(1−Rcy)×pfeed−for−human+(1−Rcy)×Cplantbased×ffinal−product−biofuelffoodCNL=Cplantbased×(1−Rcy)+Cmarine−catch×(1−Rmarine−catch−y)+Cplantbased×ffeed−to−food×(1−Rcy)×pfeed−for−human+(1−Rcy)×Cplantbased×ffinal−product−biofuelffood
(7)
CNLis national-level available calories in theNo Livestockcase.ffeed-to-foodis the fraction of food crops that are used as feed relative to their usage as food, calculated based on their calorie content26.pfeed-for-humanis the percentage of livestock grain feed used for human consumption. We tested 0%, 20%, 40%, 50%, 60%, 80% and 100% and used 50% for Table2and Fig.4.
For thePartial Livestockcase, national-level available calories are calculated by
CPL=Cplantbased×(1−Rcy)+Cmarine−catch×(1−Rmarine−catch−y)+Cplantbased×ffeed−to−food×(1−Rcy)×pfeed−for−human+(1−pfeed−for−human)×(Clivestock−ruminant×(1−Rgrass)+Clivestock−monogastric×(1−Rcy)+Clivestock−monogastric×Rgrass×(1−Rcy)×Fruminant−cropfeedFmonogastric−cropfeed)+(1−Rcy)×Cplantbased×ffinal−product−biofuelffoodCPL=Cplantbased×(1−Rcy)+Cmarine−catch×(1−Rmarine−catch−y)+Cplantbased×ffeed−to−food×(1−Rcy)×pfeed−for−human+(1−pfeed−for−human)×(Clivestock−ruminant×(1−Rgrass)+Clivestock−monogastric×(1−Rcy)+Clivestock−monogastric×Rgrass×(1−Rcy)×Fruminant−cropfeedFmonogastric−cropfeed)+(1−Rcy)×Cplantbased×ffinal−product−biofuelffood
(8)
CPL is national-level available calorie in Partial Livestock case. On the basis of the assumed percentage of livestock crop feed to convert to human consumption, instead of wasting the remaining portion of livestock crop feed as in No Livestock case, here we use the remaining livestock crop feed to raise livestock.
The percentage of national household waste is calculated by
Pwaste=100%×Cavailable−CintakeCavailablePwaste=100%×Cavailable−CintakeCavailable
(9)
Pwaste is the percentage of national household waste of food calorie availability in 2010, Cavailable is the food calorie availability per day per person in each country and Cintake is the national calorie intake per day per person27.
Calorie requirements
The population percentage supported by available calories calculated for theLivestock, Partial LivestockandNo Livestockresponses indicates the macro-level consequences for food security (Fig.4). The current average human available calorie supply is 2,855 kcal per capita per day, including food intake and food waste (Fig.3). Calorie requirements vary significantly with age, gender, size, climate, level of activity and underlying medical conditions. Ref.27estimated the national-level calorie availability, calorie intake, calorie from plant-based product, livestock and fish and also calculated the calorie intake of an underweight population with current physical activity of an underweight population with sedentary physical activity and calorie intake lower than the basal metabolic rate. We assume that the calorie intake of an underweight population with current physical activity is needed to support life and regular labour activity.
Uncertainties
This work was done with one Earth system model, with only one ensemble member for all the cases with soot injections >5 Tg, only one crop model and only one fishery model. For the 5 Tg case and the control, there are three ensemble members, but only the ensemble averages are used. The three ensemble members for the 5 Tg case are very similar (Supplementary Fig.8), so climate variability for the larger forcings would be much smaller than the signal.
CESM is a state-of-the-art climate model, and its simulations of the impacts of nuclear war have been almost identical to simulations with other models for the 5 Tg (refs. 49,50) and 150 Tg (ref. 9) cases. However, further developments in climate models, such as including organic carbon in fire emissions, and better simulating aerosol growth and interactions with the surrounding environment, may improve climate prediction after a nuclear war.
CLM5crop and BOATS are also state-of-the-art models, but future simulations with different models would certainly be useful. CLM5crop compares well with other crop models in response to nuclear war forcing14 (Supplementary Fig. 2). If anything, CLM5crop underestimates the crop response to nuclear war (Fig. 2 and Supplementary Fig. 2). Because most crop models were developed for the current or warmer climates, further research is needed to understand how crops react to a suddenly cold environment. Our study is the first step to reveal national food security after nuclear wars, but crops may not respond uniformly to the same forcing in each nation, given different farming practices. In addition, multi-model assessment will be essential to fully investigate this problem, and crop model developments are important to understand impacts from surface ozone, ultraviolet radiation and freshwater availability. Furthermore, local radioactive contamination and climate change from nuclear war would impact the insect community. The influence on pests, pollinators and other insects is unclear, and hence further studies are needed.
Some assumptions in this study could be examined in future work. For example, to turn off international trade, the ratio of local production to domestic supply is applied on a national level. Also, to calculate national calorie intake after nuclear wars, we assume that food is evenly distributed in each country. Economic models will be necessary to further understand the contributions of trade and local food distribution systems to human calorie intake after nuclear wars.
This study uses calorie intake from ref. 27, and food loss from harvesting is not considered. If human behaviour and the food industry would change substantially, this would affect our conclusions.
Reporting summary
Further information on research design is available in theNature Research Reporting Summarylinked to this article.
Data availability
Data of crop yield, grass production, national livestock feed, national calorie and national plant product usage are available athttps://osf.io/YRBSE/. Additional data that support the findings of this study are available from the corresponding author upon request.
Code availability
The source code for the CESM(WACCM) model used in this study is freely available athttps://www.cesm.ucar.edu/working_groups/Whole-Atmosphere/code-release.html, and the code for CLM5 is available athttps://www.cesm.ucar.edu/models/cesm2/land/.
References
-
Oman, L., Robock, A., Stenchikov, G. L. & Thordarson, T. High-latitude eruptions cast shadow over the African monsoon and the flow of the Nile. Geophys. Res. Lett. 33, L18711 (2006).
-
Wood, G. D. Tambora: The Eruption That Changed The World (Princeton Univ. Press, 2014).
-
Stommel, H. & Stommel, E. Volcano Weather; The Story of 1816, The Year Without a Summer (Seven Seas Press, 1983).
-
Turco, R. P., Toon, O. B., Ackerman, T. P., Pollack, J. B. & Sagan, C. Nuclear winter: global consequences of multiple nuclear explosions. Science 222, 1283–1292 (1983).
-
Aleksandrov, V. V. & Stenchikov, G. L. On the modeling of the climatic consequences of the nuclear war. Proc. Applied Math (Computing Centre of the USSR Academy of Sciences, 1983).
-
Robock, A. Snow and ice feedbacks prolong effects of nuclear winter. Nature 310, 667–670 (1984).
-
Robock, A. et al. Climatic consequences of regional nuclear conflicts. Atm. Chem. Phys. 7, 2003–2012 (2007).
-
Robock, A., Oman, L. & Stenchikov, G. L. Nuclear winter revisited with a modern climate model and current nuclear arsenals: still catastrophic consequences. J. Geophys. Res. 112, D13107 (2007).
-
Coupe, J., Bardeen, C. G., Robock, A. & Toon, O. B. Nuclear winter responses to global nuclear war in the Whole Atmosphere Community Climate Model Version 4 and the Goddard Institute for Space Studies ModelE. J. Geophys. Res. Atmos. 124, 8522–8543 (2019).
-
Harwell, M. A. & Cropper Jr., W. P. in Environmental Consequences of Nuclear War, SCOPE 28, Volume II Ecological and Agricultural Effects, 2nd Edn (eds Harwell, M. A. & Hutchinson, T. C.) Ch. 4 (Wiley, 1989).
-
Cropper Jr., W. P. & Harwell, M. A. in Environmental Consequences of Nuclear War, SCOPE 28, Volume II Ecological and Agricultural Effects, 2nd Edn (eds Harwell, M. A. & Hutchinson, T. C.) Ch. 5 (Wiley, 1989).
-
Xia, L. & Robock, A. Impacts of a nuclear war in South Asia on rice production in mainland China. Climatic Change 116, 357–372 (2013).
-
Özdoğan, M., Robock, A. & Kucharik, C. Impacts of a nuclear war in South Asia on soybean and maize production in the Midwest United States. Climatic Change 116, 373–387 (2013).
-
Jägermeyr, J. et al. A regional nuclear conflict would compromise global food security. Proc. Natl Acad. Sci. USA 117, 7071–7081 (2020).
-
Scherrer, K. J. N. et al. Marine wild-capture fisheries after nuclear war. Proc. Natl Acad. Sci. USA 117, 29748–29758 (2020).
-
Toon, O. B. et al. Atmospheric effects and societal consequences of regional scale nuclear conflicts and acts of individual nuclear terrorism. Atm. Chem. Phys. 7, 1973–2002 (2007).
-
Robock, A. & Zambri, B. Did smoke from city fires in World War II cause global cooling. J. Geophys. Res. Atmos. 123, 10314–10325 (2018).
-
Toon, O. B. et al. Rapid expansion of nuclear arsenals by Pakistan and India portends regional and global catastrophe. Sci. Adv. 5, eaay5478 (2019).
-
Yu, P. et al. Black carbon lofts wildfire smoke high into the stratosphere to form a persistent plume. Science 365, 587–590 (2019).
-
Yu, P. et al. Persistent stratospheric warming due to 2019–2020 Australian wildfire smoke. Geophys. Res. Lett. 48, e2021GL092609 (2021).
-
Peterson, D. A. et al. Australia’s Black Summer pyrocumulonimbus super outbreak reveals potential for increasingly extreme stratospheric smoke events. npj Clim. Atmos. Sci. 4, 38 (2021).
-
Ambio Advisory Group, Reference scenarios: How a nuclear war might be fought, in Nuclear War: The Aftermath (ed Peterson, J.) Ch. 3 (Pergamon Press, 1983).
-
Food Composition Tables (FAO, 2022); http://www.fao.org/3/X9892E/X9892e05.htm
-
Food Balances (FAO, 2022); http://www.fao.org/faostat/en/#data/FBSH
-
Falkendal, T. et al. Grain export restrictions during COVID-19 risk food insecurity in many low- and middle-income countries. Nat. Food 2, 11–14 (2021).
-
Weindl, I. et al. Livestock and human use of land: productivity trends and dietary choices as drivers of future land and carbon dynamics. Glob. Environ. Change 47, 121–132 (2017).
-
Bodirsky, B. et al. mrcommons: MadRat Commons Input Data Library. R version 1.9.3 https://github.com/pik-piam/mrcommons (2022).
-
Bodirsky, B. L. et al. The ongoing nutrition transition thwarts long-term targets for food security, public health and environmental protection. Sci. Rep. 10, 19778 (2020).
-
National Research Council, Energy, in Recommended Dietary Allowances, 10th Edn Ch. 3 (US National Academies Press, 1989).
-
FAO, IFAD, UNICEF, WFP and WHO The State of Food Security and Nutrition in the World 2021 (FAO, 2021).
-
Alvarado, K. A., Mill, A., Pearce, J. M., Vocaet, A. & Denkenberger, D. Scaling of greenhouse crop production in low sunlight scenarios. Sci. Total Environ. https://doi.org/10.1016/j.scitotenv.2019.136012 (2019).
-
Denkenberger, D., Pearce, J. M. Feeding Everyone No Matter What: Managing Food Security After Global Catastrophe (Academic Press, 2014).
-
Martínez, J. B. G. et al. Potential of microbial protein from hydrogen for preventing mass starvation in catastrophic scenarios. Sustain Prod. Consum. 25, 234–247 (2021).
-
Throup, J. et al. Rapid repurposing of pulp and paper mills, biorefineries, and breweries for lignocellulosic sugar production in global food catastrophes. Food Bioprod. Process. 131, 22–39 (2022).
-
Hochman, G. et al. Economic incentives modify agricultural impacts of nuclear war. Env. Res. Lett. 17, 054003 (2022).
-
Bardeen, C. G. et al. Extreme ozone loss following nuclear war resulting in enhanced surface ultraviolet radiation. J. Geophys. Res. Atmos. 126, e2021JD035079 (2021).
-
Grover, H. D. & Harwell, M. A. Biological effects of nuclear war II: impact on the biosphere. Bioscience 35, 576–583 (1985).
-
Denkenberger, D. C. & Pearce, J. M. Feeding everyone: solving the food crisis in event of global catastrophes that kill crops or obscure the sun. Futures 72, 57–68 (2015).
-
Hurrell, J. W. et al. The Community Earth System Model: a framework for collaborative research. Bull. Am. Meteorol. Soc. 94, 1339–1360 (2013).
-
Marsh, D. R. et al. Climate change from 1850 to 2005 simulated in CESM1(WACCM). J. Clim. 26, 7372–7390 (2013).
-
Lombardozzi, D. L. et al. Simulating agriculture in the Community Land Model Version 5. J. Geophys. Res. Biogeosci. 125, e2019JG005529 (2020).
-
Fan, Y. et al. Solar geoengineering can alleviate climate change pressure on crop yields. Nat. Food 2, 373–381 (2021).
-
Lawrence, D. M. et al. The Community Land Model version 5: description of new features, benchmarking, and impact of forcing uncertainty. J. Adv. Modeling Earth Systems 11, 4245–4287 (2019).
-
Carozza, D. A., Bianchi, D. & Galbraith, E. D. Formulation, general features and global calibration of a bioenergetically-constrained fishery model. PLoS ONE 12, e0169763 (2017).
-
Carozza, D. A., Bianchi, D. & Galbraith, E. D. The ecological module of BOATS-1.0: a bioenergetically constrained model of marine upper trophic levels suitable for studies of fisheries and ocean biogeochemistry. Geosci. Model Dev. 9, 1545–1565 (2016).
-
The State of World Fisheries and Aquaculture 2020. Sustainability in Action (FAO, 2020); https://doi.org/10.4060/ca9229en
-
Commodity Balances (FAO, 2022); https://www.fao.org/faostat/en/#data/CB
-
Mottet, A. et al. Livestock: on our plates or eating at our table? A new analysis of the feed/food debate. Glob. Food Sec.14, 1–8 (2017).
-
Mills, M. J., Toon, O. B., Lee-Taylor, J. & Robock, A. Multi-decadal global cooling and unprecedented ozone loss following a regional nuclear conflict. Earth’s Future 2, 161–176 (2014).
-
Stenke, A. et al. Climate and chemistry effects of a regional scale nuclear conflict. Atmos. Chem. Phys. 13, 9713–9729 (2013).
-
Toon, O. B., Robock, A. & Turco, R. P. Environmental consequences of nuclear war. Phys. Today 61, 37–42 (2008).
Acknowledgements
This study was supported by the Open Philanthropy Project, with partial support from the European Research Council under the European Union’s Horizon 2020 Research and Innovation Programme under grant agreement 682602. A.R. and L.X. were supported by National Science Foundation grants AGS-2017113 and ENG-2028541. K.S. was supported by the European Research Council under the European Union’s Horizon 2020 Research and Innovation Programme under grant agreement 682602 and Research Council of Norway project 326896. C.S.H., C.G.B. and O.B.T. were supported by the Open Philanthropy Project. J.J. was supported by the NASA GISS Climate Impacts Group and the Open Philanthropy Project. B.L.B. has received funding from the European Union’s Horizon 2020 research and innovation programme under grant agreement number 776479 (COACCH) and 821010 (CASCADES). I.W. and B.L.B. have received funding from the German Federal Ministry of Education and Research (BMBF) in the context of the project ‘FOCUS–Food security and sustained coastal livelihoods through linking land and ocean’ (031B0787B). R.H. was supported by the European Research Council under the European Union’s Horizon 2020 Research and Innovation Programme under grant agreement 682602. We thank I. Helfand for valuable suggestions on the work and D. Lombardozzi for supporting CLM5crop simulations.